What is it?
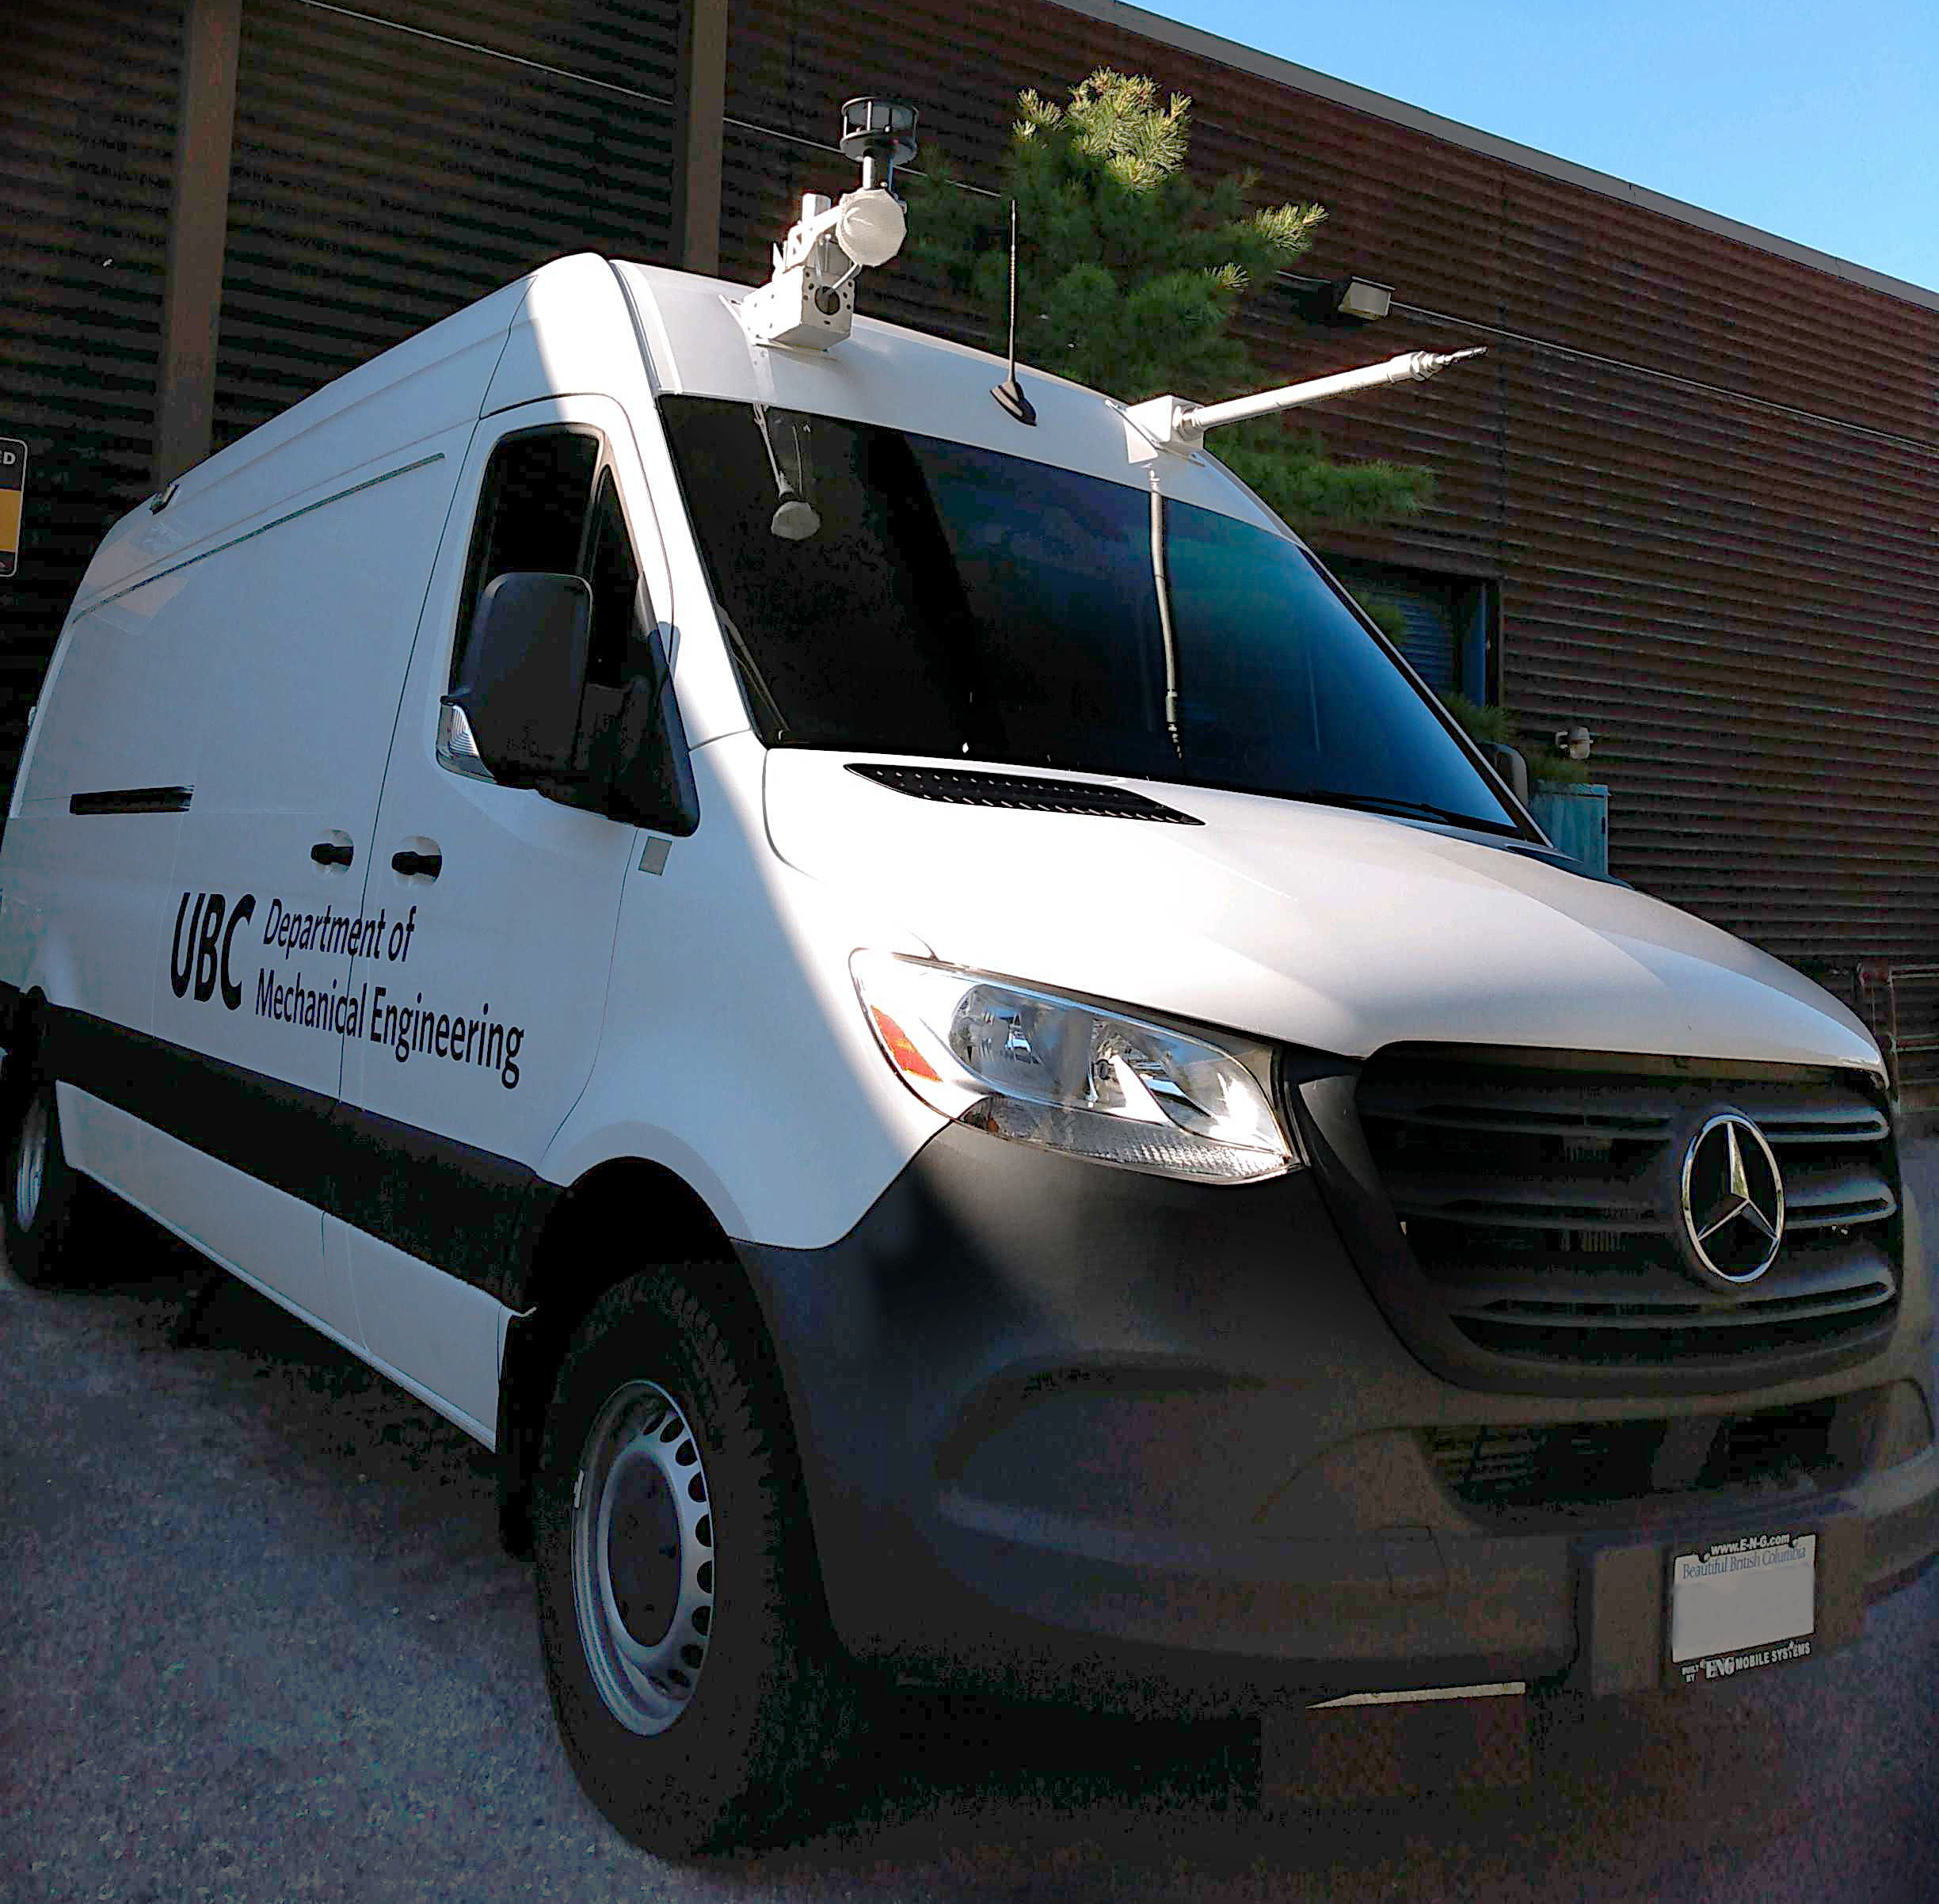
The UBC PLUME Van, short for Portable Laboratory for Understanding human-Made Emissions, is a mobile laboratory used to measure air pollutant concentrations in and around Metro Vancouver and British Columbia. The van contains a wide variety of highly precise instrumentation used to measure concentrations air pollutants such as ground-level ozone (O3), carbon monoxide (CO), carbon dioxide (CO2), nitrous oxides (NOX), black carbon, methane, volatile organic compounds (VOCs), and various sizes of ultrafine particles (the smallest component of PM2.5). Using the PLUME Van, we can measure concentrations of these air pollutants as well as meteorological parameters like wind speed and wind direction, all which help us understand the impacts of different industries, vehicle emissions, or fugitive methane.
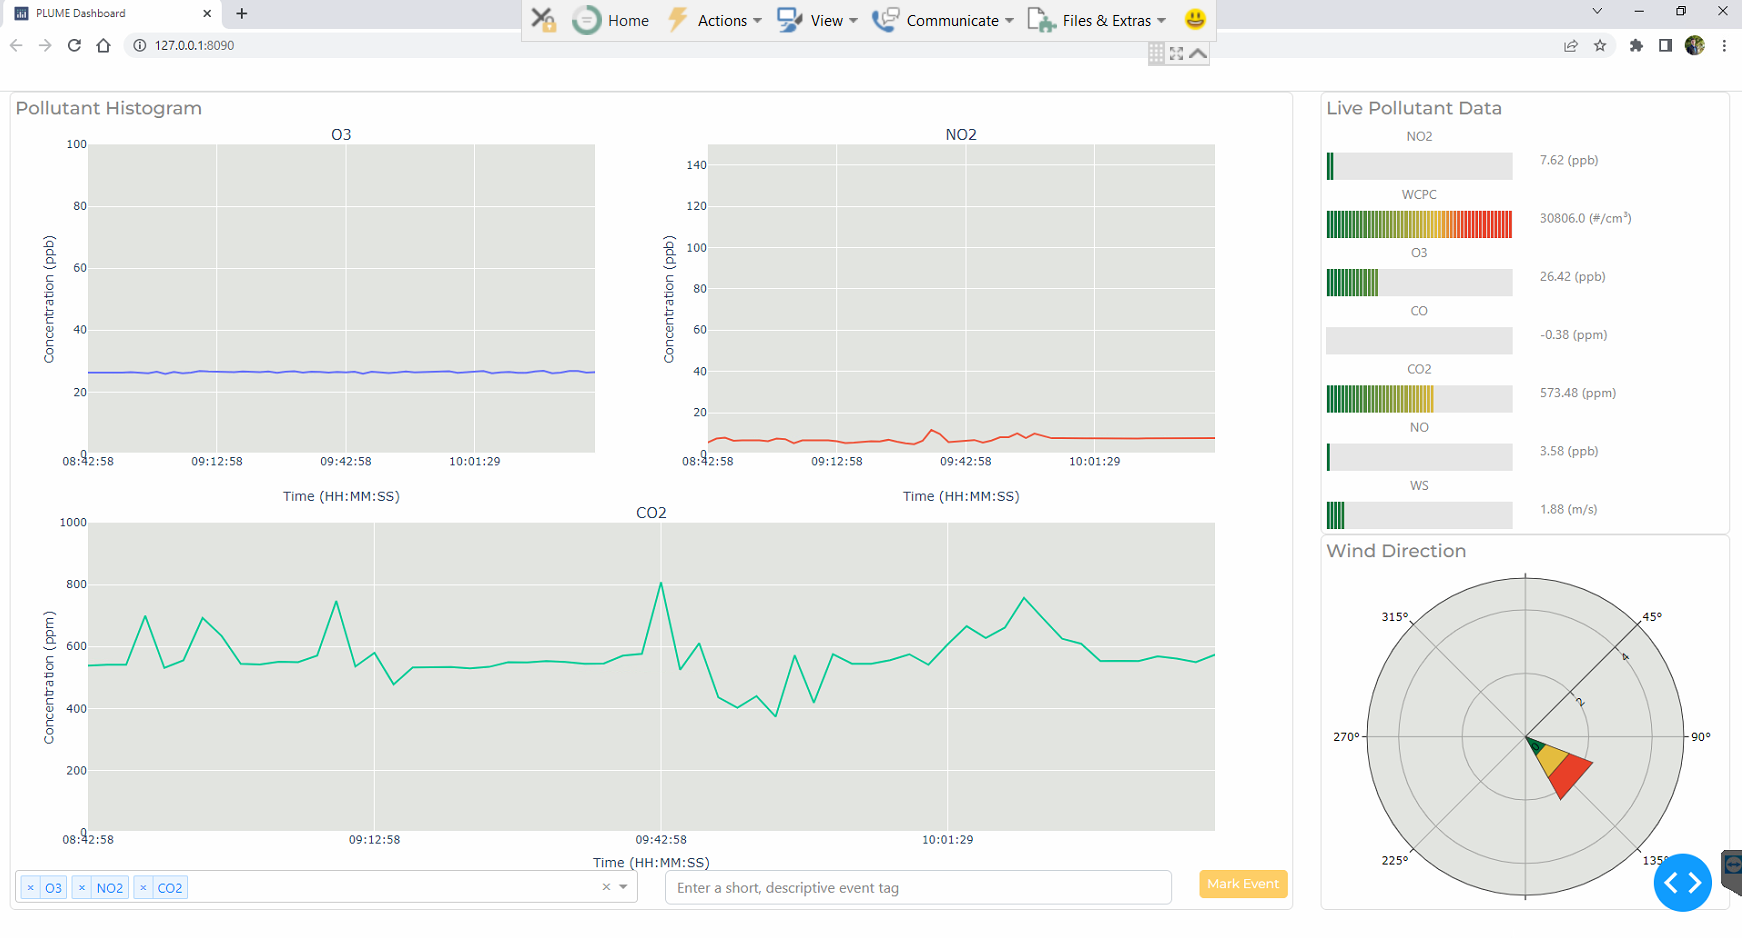
Live air pollutant and windspeed data streaming onto our real-time dashboard. Plots on the left show time series trends, the instantaneous concentrations are top-right, and wind speed and relative wind direction is bottom left.
Why use a mobile laboratory?
A mobile laboratory allows us to sample air pollutants anywhere a vehicle can go, in near-real time. This provides better spatial and temporal resolution than a traditional stationary air quality monitoring station. The instrumentation in the PLUME Van allows us to collect data as often as every second and displays the results on our dashboard.
An advantage of using a mobile laboratory rather than fixed air quality sensors is we cover a greater spatial range. With the mobile laboratory, we can sample anywhere from highways, to by the ocean, to the middle of a field with the same instrumentation in a single day.
Why Measure These Pollutants?
Air pollution is an urgent problem linked to the warming climate, and to an estimated nine million premature deaths per year worldwide. According to the World Health Organization, an estimated 99% of the global population breathes air that exceeds the WHO guideline limits. Breathing polluted air is linked to numerous health problems such as strokes, headaches, chronic illnesses, lung cancer and acute respiratory infections (World Health Organization, 2022).
Ozone (O3)
Ground-level ozone is a harmful air pollutant which can trigger a variety of health problems such as chest pain, throat irritation, and coughing. It can also worsen existing conditions such as bronchitis, asthma, and emphysema. Ground-level ozone is a major greenhouse gas as it contributes to warming in the atmosphere, and it can damage the environment as it is an important component of urban smog (Environmental Protection Agency, 2021).
We are measuring ground-level ozone in parts per billion (ppb) – equivalent a drop of water in an Olympic sized pool – to determine major sources of ozone in urban regions and determine how much ozone is produced from traffic and some industries.
Carbon monoxide (CO)
Carbon Monoxide is a colourless, odourless gas produced by many materials when burned. At low concentrations, it can cause fatigue and impaired vision, while at high concentrations, it can cause dizziness, confusion, nausea and in extreme cases, death. In the atmosphere, CO participates in chemical reactions to produce ozone, which is a strong greenhouse gas resulting in warming of the atmosphere (Environmental Protection Agency, 2021).
We are measuring carbon monoxide in ppb to determine major sources of CO in urban regions and determine how much CO is produced from traffic.
Carbon dioxide (CO2)
Carbon Dioxide is the primary greenhouse gas emitted through human activity and is a major contributor to climate change. CO2 has risen from 315ppm in the 1950s to 420ppm in 2022 contributing to the global temperature increase we have seen in recent years (Lindsey, 2021). CO2 levels are a concern since CO2 readily traps heat and has a long lifetime in the atmosphere.
We are measuring carbon dioxide in ppm – equivalent to a drop of water in a large kitchen sink – to determine major sources of CO2 in urban regions as it is a major greenhouse gas contributing to climate change.
Nitrogen oxides (NOX)
Exposure to nitrogen oxides (a combination of nitrogen monoxide, NO, and nitrogen dioxide, NO2) can cause difficulty breathing, headaches, eye irritation and loss of appetite, and can damage the ecosystem by reacting with other pollutants to form acid rain. NOX also reacts with other chemicals to produce ozone which is a strong greenhouse gas (Phys Org, 2015).
We are measuring NOX in ppb to determine major sources of NOX in urban regions and determine how much NOX is produced from traffic and industry.
Volatile organic compounds (VOCs)
Volatile Organic Compounds (VOCs) are often human-made compounds coming from building materials, cleaning reagents, and more. Inhaling VOCs can cause eyes, nose and throat irritation, difficulty breathing, nausea, and headaches. In the atmosphere, VOCs can react with NOx to produce ozone which is a strong greenhouse gas. VOCs can also be emitted by plants (i.e., agriculture and forests), called Biogenic-VOCs or BVOCs. In many regions, BVOCs exceed those anthropogenically emitted, thus are also of interest to be monitored (Environmental Protection Agency, 2022).
We are measuring anthropogenic VOCs and BVOCs in ppb and characterizing their composition in the air to determine major sources of VOCs and BVOCs in urban regions and to determine the amount produced from traffic, industry, vegetation, and agricultural practices.
Ultrafine Particles (UFPs)
Ultrafine particles (UFP) are measured in total number per volume of air. They are of concern as they can penetrate deep into the lungs, and then translocate to other organs in the body. Depending on their size distribution, they can also directly and indirectly affect climate change (Saha, 2018). Behaviour of UFPs are not well understood, and they are known to have substantial variation in time and space.
We are measuring UFPs in number of particles per cubic meter (#/m3) to determine the amount produced by traffic and industry, and to better understand spatial and temporal changes in UFP concentrations.
Methane (CH4)
Methane is a major greenhouse gas which contributes greatly to global warming. It has a warming effect (i.e., radiative forcing) even greater than that of CO2, however it has a shorter lifespan in the atmosphere, so reductions in methane to reduce short-term climate change effects are important. Methane is also a primary contributor to the formation of ground-level ozone, another strong greenhouse gas, making it an even greater climate threat (UN Environment Programme, 2021).
We are measuring methane in ppm as it is a very strong greenhouse gas contributing to global climate change. We hope to identify fugitive methane from a variety of sources including natural gas powered vehicles and emissions from the production of natural gas.
Black Carbon
Black Carbon has negative implications for both human health and the climate. Inhalation of Black Carbon is associated with serious health problems such as respiratory and cardiovascular disease, cancer, and birth defects. It is also a very strong greenhouse gas, with a warming impact that is many thousand times stronger than CO2 but is very short-lived in the atmosphere. Even in this short time, black carbon can have significant impacts on the climate, agriculture, and human health (UNEP, 2017).
We are measuring black carbon in micrograms per cubic meter (µg/m3). Characterizing black carbon is important from wildfires and from engine exhaust.
What does ppm, ppb, µg/m3 and #/m3 mean?
Just as per cent means out of a hundred, parts per million (ppm) means out of a million, and parts per billion (ppb) means out of a billion. We will be measuring methane (CH4), CO, and CO2 in parts per million (ppm), which is equivalent to a drop of water in a large kitchen sink. We will be measuring O3 and NOX in parts per billion (ppb), which is equivalent to a drop of water in an Olympic sized swimming pool. We are measuring black carbon in micrograms of contamination per cubic meter (µg/m3). A microgram is equal to one millionth of a gram. We are measuring ultrafine particles in number of particles per cubic meter of air.
Applications
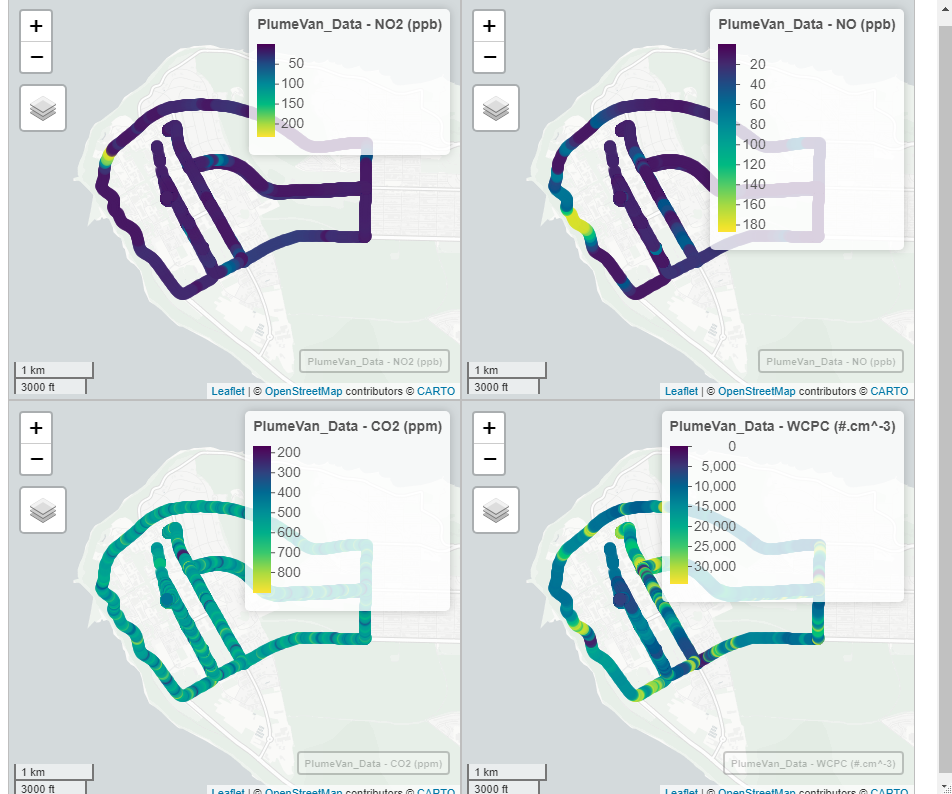
Using the data collected from the PLUME Van, we can produce maps and time-series to display the results.
Publications
The PLUME Van launched in Summer 2022 and publications are forthcoming. Stay tuned!
PLUME Van Team
It took a lot of people to make the PLUME van come to life! We want to celebrate those who had a hand in building the van.
- Naomi Zimmerman, Principal Investigator
- Davi Monticelli, Ph.D. Student
- Melanie MacArthur, M.A.Sc. Candidate
- Stefan Colbow, B.A.Sc. Researcher
- Chris Kelly, B.A.Sc. Researcher
- Rachel Habermehl, B.Sc. Researcher
- Julian Fawkes, B.A.Sc. Researcher
References
- World Health Organization. (2022). Air Pollution. World Health Organization. Retrieved April 19, 2022. [LINK]
- Environmental Protection Agency. (2021). Health Effects of Ozone Pollution. EPA. Retrieved April 19, 2022. [LINK]
- Environmental Protection Agency. (2021). Carbon Monoxide’s Impact on Indoor Air Quality. EPA. Retrieved April 19, 2022. [LINK]
- org. (2015, September 23). Nox gases in diesel car fumes: Why are they so dangerous? Phys.org. Retrieved April 19, 2022. [LINK]
- Lindsey, R. (2021). Climate change: Atmospheric carbon dioxide. Climate Change: Atmospheric Carbon Dioxide | NOAA Climate.gov. Retrieved April 19, 2022. [LINK]
- Environmental Protection Agency. (2022). What are volatile organic compounds (VOCs)? Retrieved April 19, 2022. [LINK]
- Saha, P. K., et al. (2018, November 14). Quantifying high-resolution spatial variations and local source impacts of urban ultrafine particle concentrations. Science of The Total Environment. Retrieved April 19, 2022. [LINK]
- UN Environment Programme. (2021). Methane emissions are driving climate change. here’s how to reduce them. Retrieved April 19, 2022. [LINK]
- UN Environment Programme. (2017). Black Carbon. Climate & Clean Air Coalition. Retrieved April 19, 2022. [LINK]